04. Pandas
- 04.01 Overview
- Pandas is a Python library.
- Pandas is a way to analyze data, like excel sheets and VBA, database ides.
- It requires less programming knowledege.
- The name "Pandas" has a reference to both "Panel Data", like the tables in databases.
- Many times, we get data from databases, instead of csv files, or json files.
- We usually get data from database. W3C separates the topic between Pandas and machine learning.
- Pandas data also work for machine learning, like predictions.
    # The following demo to demonstrate the structure of dataframe.

    import pandas as pd
    mydataset = {
      'cars': ["Honda", "Toyota", "Ford"],
      'ages': [6, 14, 3],
      'color': ["blue", "grey", "black"]
    }
    myvar = pd.DataFrame(mydataset)
    print(myvar)
                cars       ages      colors
            0  Honda          6       blue
            1  Toyota        14       grey
            2  Ford           3       black
- The process is to create a dataframe fom a python dictionary .
- All the values are type list.
- In the dataframe, cars, ages, colors are column names.
- In the dataframe, the left side, 0, 1,2 are index for rows
- Using method print for dataframe gives the whole table.
04.02 Named Indexes, Merge dataframes
- With the index argument, you can name your own indexes
- The following code, it is the same as default.
- To merge dataframes, use pandas's concat method.
    import pandas as pd
    data1 = {
        "calories": [420, 380, 390],
        "duration": [50, 40, 45]
    }
    df1 = pd.DataFrame(data1, index = [0, 1, 2])

    data2 = {
        "calories": [450, 580, 600],
        "duration": [55, 65, 75]
    }
    df2 = pd.DataFrame(data2, index = [3, 4, 5])

    frames = pd.concat([df1, df2])  # list
    print(frames)        # 6 rows
04.03 Filtering or Subset
- DataFrame has attribute loc for filtering.
- Technically, it is not a FUNCTION.
- It prepares a subset, and RETURNS it.
- In this case, it returns a subset of a dataframe.
                # continue from the previous esample
                # demo 04.03.1           filtering by conditions
                frames = ...
                df_long_duration = frames.loc[frames.duration >= 65]
                print(df_long_duration)           # two rows
                Just like where clause in SQL

                # demo 04.03.2           select rows
                df24 = frames.loc[2:4]
                print(df24)             # rows, index 2, 3, 4(included)

                # demo 04.03.3           select columns
                df4cols = frames.loc[:,["durations"]]
                print(df4cols)
                ALL rows, only column durations

                # demo 04.03.4           select rows and columns
                dfrc = frames.loc[0:1,["durations"]]
                print(dfrc)              # rows with index 0, and 1, only column durations
04.04 Series
- In the following code, step 1 is to create a dataframe with one column.
- Step 2 is to convert it to a Series object.
- Step 3 is to analyze data from the Series object.
                import pandas as pd
                data = {                            # dictionary, its item value is a list
                    "calories": [420, 380, 390, 500, 600],
                    "duration": [52, 40, 46, 60, 70]
                }

                df = pd.DataFrame(data, columns = ["duration"])  # data frame with  one column
                s = df.squeeze()       # df => series
                print(s)               # 52, 40, 46, 60, 70
                print(type(s))         # Series

                mean = s.mean()
                print(mean)               # 53.6   sum / 5

                median = s.median()
                print(median)             # 52.0   middle

                std = s.std()
                print(std)                # 11.78  standard deviatio
04.05 IO
- Pandas provides methods to interface with files or databases.
- Examples are listed ad below:
- pd.read_csv("data.csv") example from w3c
- pd.read_json("data.json") example from w3c
- pd.read_sql_query("SELECT ...", con) for sqlite , Sql db
- pd.DataFrame(list(mycollection.find())) for mongodb, NoSqldb
- note 1: The results are framework objects, which are for DATA VISUALIZATION or DATA ANALYSIS.
- note 2: for file io
- The data file and the python file do not have to be in the same folder.
- one example like pd.read('../myfolder/data.csv')
- The two is in peer relation.
- .. is to go up one level
- /myfoler is to from the top level to go down one level, myfolder.
- In myfolder, access data2.csv.
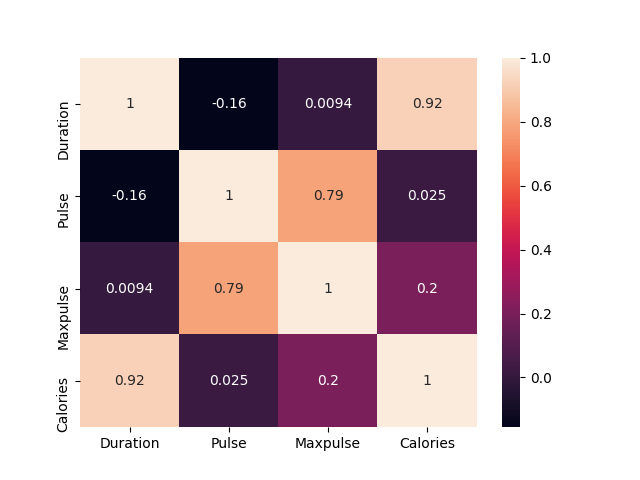
- note 3: examining w3c Pandas data.json
- It is a dictionary with 4 key-value pairs,
- The keys are Duration, Pulse, Maxpulse, Calories.
- The values are the lists of numbers.
- The list size are the SAME.
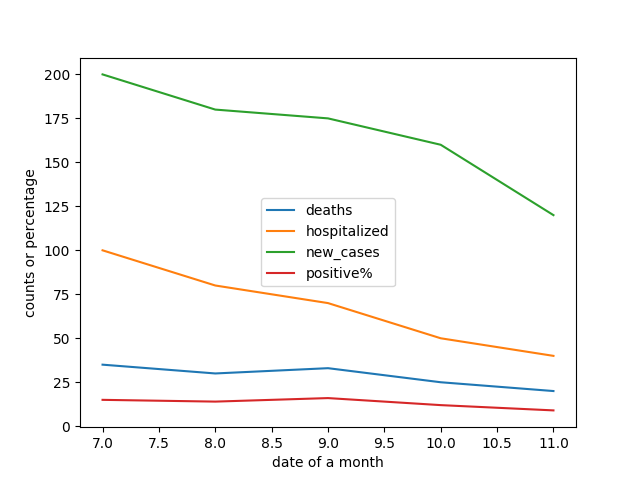
04.06 DateFrame for Plotting
--- DEMO 1 ---
        import pandas as pd
        import matplotlib.pyplot as plt

        data = {
            'new_cases':    [200, 180, 175, 160, 120],
            'hospitalized': [100,  80,  70,  50,  40],
            'deaths':       [35,   30,  33,  25,  20],
            'positive%':    [15,   14,  16,  12,   9]
        }

        df = pd.DataFrame(data, index=[7,8,9,10,11])

        myfig = df.plot.line()
        myfig.set_xlabel("date of a month")
        myfig.set_ylabel("counts or percentage")

        plt.show()
- descriptions for demo 1
- This is a very common case to see how things changes with time.
- For y-axis, there are MANYfor monitor, like death count.
- For x-axis, there is only time, like day of a month.
- In method pd.DataFrame, the argument index is to define the time values.
- We can more easily to get a idea by visualize a figure.
- Only one statement to create a figure from a dataframe directly.
- In demo 1, the data is from a python dictionary object.
- Module panda is used to create a data frame object.
- The dataframe is used to draw a figure drom data.
- Module matplotlib.pylot is to render the figure on the device.
--- DEMO 2 ---
- data from Sqlite relation database
- in mac, use the ide, DB Browser Sqlite, to create a database.
- The database name is test315.
- The file name is test315.db.
- The file is in the same folder for my later python code.
- add a table, mytable, with 4 columns as demo 1.
- added 5 rows.
- create a python file as below.
- run it, get the result as demo 1, with extra labels for x, y axis.
            data in the database
                new_cases   hospitalized    deaths     testpositive
                200         100             35         15
                ....
                15          14              16         9


            python code
            import sqlite3
            conn = sqlite3.connect('test315.db')    # database in folder peter
            import pandas as pd
            import matplotlib.pyplot as plt

            df = pd.read_sql_query("select * FROM mytable", conn)   # DataFrame

            df2 = pd.DataFrame(df.values,
               index=[7,8,9,10,11],
               columns=['new cases', 'hospitalized', 'deaths', 'test positive %'])

            myfig = df2.plot.line(title='COV-19 update, town xyz, March 2021')

            myfig.set_xlabel("date of a month")
            myfig.set_ylabel("counts")
            plt.show()
            conn.close()
- descriptions from demo 2
- The data in demo 2 is from a relation database, sqlite.
- Panda provides a method to retrieve data from the sqlite databases to a data frame for draw.
- It is a common way to get data.
- There are similar way for other relation or NoSql databases.
- One method's argument is a sql statement.
- A sql statement can also be used to process the data in database tier.
        Another way for io.
              mycursor = mydb.cursor()  # Cursor is an object to store rows temporary in memory.
              mycursor.execute("SELECT * FROM customers")
              myresult = mycursor.fetchall()
        If the above code is used to IO, a list of tuples will be returned.
--- DEMO 3, Scatter Plot ---
- w3c tutorial, Pandas, Plot, scatter example is used.
- data
- csv file
- Two columns are involved - exercise duration, calories consumption.
- Plot points with duration as x-axis, calorire as y-axis for all rows.
          import pandas as pd
          import matplotlib.pyplot as plt
          df = pd.read_csv('data.csv')        #comment: It can be from a database.
          df.plot(kind = 'scatter', x = 'Duration', y = 'Calories')
          plt.show()
- The plot helps you to see the correlation between the two.
- In this case, there is a relationship between the two columns.
- It is linear.
- The calories consumes more as the duration increases.
--- DEMO 4, Line Plot ---
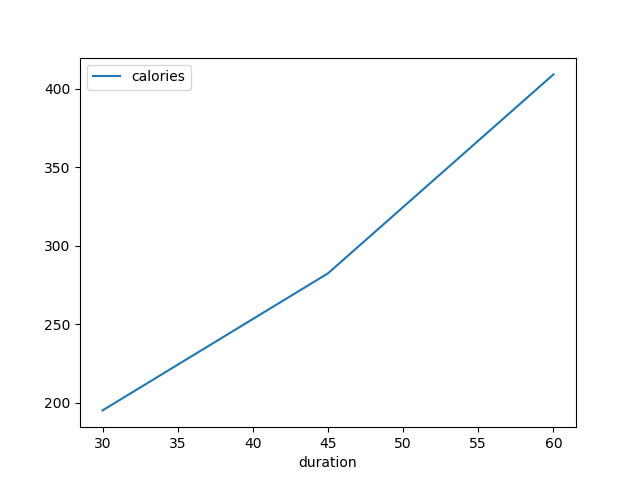
- continue from demo 3, the same data
- Replacing the line for plot as below:
df.plot.line(x = "Durations", y ="Calories"). - The default kind for df.plot is line plot.
- The method will plot lines between two points from any adjacent two data rows automatically.
- The focus is the relationship between them.
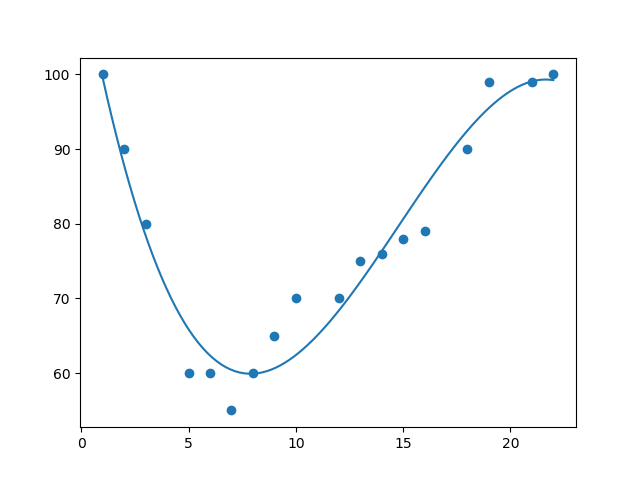
--- DEMO 5, histogram ---
import pandas as pd
import matplotlib.pyplot as plt
df = pd.read_csv('data.csv')
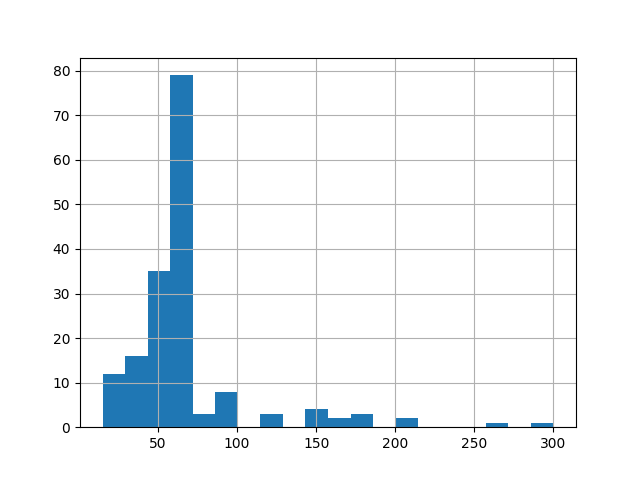
df["Duration"].hist(bins=20)
plt.show()
- When people exercise, they record the duration of exercises.
- In this demo, the data is in a csv file.
- The duration ranges are in x-axis.
- The counts for any duration range are in y-axis
- From the plot, you can tell the counts for all ranges.
- In this demo, the person ususaly spends 60-70 minutes for exercise.
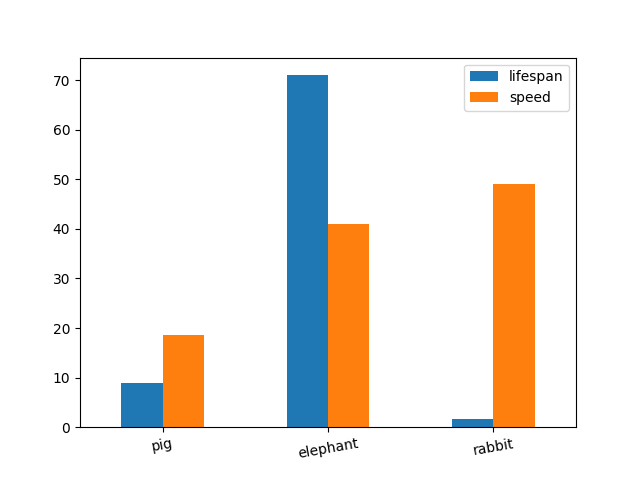
--- DEMO 6, bar plot ---
            import pandas as pd
            import matplotlib.pyplot as plt

            speed = [18.5, 41, 49]                 #avg values
            lifespan = [9, 71, 1.6]                #avg values
            index = ['pig', 'elephant','rabbit']
            df = pd.DataFrame({'speed': speed, 'lifespan': lifespan},
                               index=index)

            df.plot.bar(rot=10)

            plt.show()
comment: What you give, what you see.
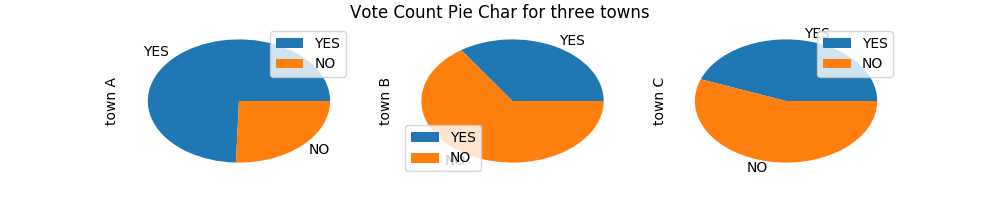
--- DEMO 7, pie plot ---
         import pandas as pd
         import matplotlib.pyplot as plt

         df = pd.DataFrame(
                  {
                      'town A':     [ 35001,   12000],      #for one subplot
                      'town B':     [ 29010,   55003],      #for one subplot
                      'town C':     [ 32597,   41055]       #for one subplot
                  },
                  index = ['YES', 'NO']        # pie items
          )
          df.plot.pie(subplots=True,
              figsize=(10,2),
              title = "Vote Count Pie Plot for three towns")

          plt.show()
--- DEMO 8, DataFrame, Mongodb, Plotting ---
------------ Prepare data in Mongodb ---------------
        import pymongo
        myclient = pymongo.MongoClient("mongodb://localhost:27017/")
        mydb = myclient["mydatabase"]
        mycol = mydb["mycollection"]    #collection, like table in sql

        # drop the collection if it exists
        mycol.drop()

        r = {"duration": 60, "calories": 409.1}     #dictionary
        d = mycol.insert_one(r)         #document, like row in sql
        r = {"duration": 45, "calories": 282.4}
        d = mycol.insert_one(r)
        r = {"duration": 30, "calories": 195.1}
        d = mycol.insert_one(r)

        # test code
        for doc in mycol.find():
            print(doc)
        # See 3 dictionaries, each has three key-value pairs.
- descriptions
- Make sure the environment is setup properly - mongodb, and the driver
- Two command windows are needed - running mongod and running your code.
- Line 1 is the driver.
- Line 2 is the mongodb client info.
- Line 3 is the database name.
- Line 4 is the collection name, like tabel in SQL db.
- Then, prepare a dictionary, and insert it into the collection. Repeat 3 times.
- Verify the result.
------- Using DataFrame to import NoSql db and plotting------
        import pymongo

        myclient = pymongo.MongoClient("mongodb://localhost:27017/")
        mydb = myclient["mydatabase"]
        mycol = mydb["mycollection"]

        import pandas as pd
        df = pd.DataFrame(list(mycol.find()))   # for many documents
        # verify
        print(df)

        import matplotlib.pyplot as plt
        df.plot.line(x = "duration", y = "calories")
        plt.show()
                  verification result
                                _id  calories  duration
                            0  ....  409.1        60
                            1  ....  282.4        45
                            2  ....  195.1        30


                  plotting

04.07 Pandas Documents...
- DataFrame is the main section in Pandas documents.
- In it, there are many methods like groupby, sort, pivot, etc.
- Examples are provided, you can use them for the needs.
- You can get data from a csr file or databases, then analyze, plot,update it.