34. Seaborn
March 11, 2019
home
Contents
- Description
- Contents
- CSV for Seaborn Data
- figure-level functions vs axes-level functions
- 11a. x-y relationship, relplot, scatter
- 11b. x-y relationship, continuity, relplot, line
- 12. distribution, distplot, histogram
- 13a. linear regression model
- 13b. non-linear regression model
- 14a. categorical-data, catploy, scatter
- 14b. categorical-data, catploy, box
- 21. sns.FacetGrid and plt.hist
- 22. sns.FacetGrid and plt.scatter
- 23. sns.FacetGrid and parameter hue
- 24. sns.FacetGrid and plotting size
- 25. sns.FacetGrid and col_wrap
- 26. sns.PairGrid and plt.scatter
- 27. sns.JointGrid and sns.regplot, sns.distplot
description
- Seaborn is a library for making statistical graphics in Python. It is built on top of matplotlib and closely integrated with pandas data structures.
- Either matplotlib.pyplot or seaborn provides methods for single-plot and multi-plots.
- I found that using seaborn is more easy for single-plot or multi-plots
I use the functions in matplotlib.pyplot only when needed.
- There are two to way to create multi-facets.
The first way is to use contruction function, like FacetGrid to create a lattice.
Then, use a map function to plot each subplots in loop.
The second way is is to add function parameter - col, row in a seaborn function.
I found the first way more easy. I use code visual studio for my labs.
- My learning materials for seaborn single-plot are from http://seaborn.pydata.org/tutorial.html
- My learning materials for seaborn multi-plots are from http://seaborn.pydata.org/api.html including Multi-plot grids, Facet grids, Pair grids, Joints grids.
overview
When you do a statistical analysis,
define what you want to see,
get data and process them,
finally, choose a plotting type to plotting.
Once you get the plotting, you can start to analyze.
This overview is for choosing the visualization plotting type.
- plotting without grid lattice - mainly for single plot
- relationship, relplot
- scatter, mainstay uses
- line, for continuity, with time-series data, usage examples like stock prices, mri labs
- distribution, distplot
- regression - - get scatter plotting first, then, select model, get the estimation from data, for prediction purpose
- regplot
- more simple, easy
- axes-level interface
- for linear regression model
- lmplot
- figure-level interface
- more options, for example for non-linear estimation
- plotting with grid lattice - create a grid structure first, then subplot all.
- FacetGrid - relationship
- PairGrid - relationship
- JointGrid - relationship and distribution
03. CSV for Seaborn data
    import pandas as pd

    tips = pd.read_csv("https://raw.githubusercontent.com/mwaskom/seaborn-data/master/tips.csv")

    print(tips.head(2))
    print('type of tips = ' + str(type(tips)))

    '''
        total_bill   tip     sex smoker  day    time  size
    0       16.99  1.01  Female     No  Sun  Dinner     2
    1       10.34  1.66    Male     No  Sun  Dinner     3
    '''
data source
- A csv is the main data format.
- It must take the form of what Hadley Whickam calls “tidy”. They is long-form data
- It is unlike other data types, like JSON data, which is in a format of hierarchical, key-value structure.
- Each column is a variable. Each row is an observation.
- The type of data is pandas.core.frame.DataFrame
- pd.read_csv function is used to get a any csv file.
- If the csv files are used by seaborn demo purposes, you save some typing as below:
import seaborn as sns
...
tips = sns.load_dataset('tips')
variable types
- Based on a variable value, its type is determined,
total_bill,16.99, for float
time, Dinner for str
size, 2 for int
- This is a dynamic feature, like Javsscript. No variable type definitions are required like SQL, Java.
- total_bill, tip are type float
- sex, smoker, day, time are type str.
- size is type int.
- Variables with type str or int are calegorical vaiables.
sns.calplot function is used for more easy plotting with categorical variable.
In addition to adding more dimensions, not just x,y, you can add semantic parameters likes hue, style...
by using categorical variables.
04. figure-level functions vs axes-level functions
4.1 figure-level functions for one plot
        tips = sns.load_dataset("tips")
        g = sns.relplot(x="total_bill", y="tip", data=tips)

        print(' type of tips = ' + str(type(tips)))
        print(' type of the method returns ' + str(type(g)))

        plt.show()
review
- pandas.core.frame.DataFrame
- function name has a universal style.
- kind: default, scatter
- seaborn.axisgrid.FacetGrid, one facet, from figure-level function
changing figure size and adding title for plotting from figure-level function
- change a figure size by add a paramter like, height=10, using the default aspect ratio.
- add a title by add the following two lines
fig = g.fig
fig.suptitle("my title", fontsize=12)
- These are NOT not for matplotlib...AxesSubplot.
4.2 axes-level functions for one plot
        import seaborn as sns
        import matplotlib.pyplot as plt
        tips = sns.load_dataset("tips")
        sns.set()
        ax = sns.scatterplot(x="total_bill", y="tip", data=tips)
review
- The type returned from the function is matplotlib.axes._subplots.AxesSubplot
changing figure size and adding title for plotting from axes-level function
- before sns.scatter, add one line of code plt.figure(figsize=(15,8))
- before sns.scatter, add one line of code ax.set_title('my scatterplot test')
- These are NOT not for figure-level plotting.
4.3 figure-level functions for many subplots
- cookie-cutter style
- All the subplots have the same configuration.
- see topic 21-27
4.4 axes-level functions for may subplots
    ...
    f, axes = plt.subplots(1, 2, sharey=True, figsize=(6, 4)) # one row, 2 columns

    sns.boxplot(x="day", y="tip", data=tips, ax=axes[0])                         #plot 1
    sns.scatterplot(x="total_bill", y="tip", hue="day", data=tips, ax=axes[1])   #plot 2

    plt.legend()
    plt.show()
- not cookie-cutter style.
- The subplots can have differnt configurations.
11a. x-y relationshiprelationship, relplot, scatter
- relplot is for relationship between two variables in x-y cooridates.
- The default kind is scatter.
- seaborn.axisgrid.FacetGrid
    import matplotlib.pyplot as plt
    import seaborn as sns

    tips = sns.load_dataset("tips")
    sns.set(style="ticks")

    g = sns.relplot(x="total_bill", y="tip", hue="day", data=tips, height=4)
    print('type of g = ' + str(type(g)))

    plt.legend()
    plt.show()
11b. x-y relationship, continuity, relplot, line
- Many x-y relationships involve with time and continuity.
- A daily stock price, a monthly real estate price index are examples.
- fMRI labs use timepoints(measurement unit) as x-coordinate, signal as y-coordinate
- many signals for one timepoint
- The default behavior in seaborn is to aggregate the multiple measurements
- at each x value by plotting the mean
- and the 95% confidence interval around the mean.
- The generated plotting is like a wave. The data is time-series.
- method: replot, kind="line"
    fmri = sns.load_dataset("fmri")
    sns.relplot(x="timepoint", y="signal", kind="line", data=fmri)
12. distribution, distplot, histogram
import numpy as np
import matplotlib.pyplot as plt
import seaborn as sns
n = np.random.normal(size=100)
ax = sns.distplot(n)
plt.show()
description
- create 100 numerical data in random with normal distribution
- univariate for x-coordinate
- function displot, default histogram
and fit a kernel density estimate (KDE)
- The y-coordinate is the approximate probability of the number of occurrences of x value.
- The sum of the probability under KDE is 1.
- Axes-level function
13a. linear regression model
descriptiojn
- Regression attempts to predict one dependent variable (usually denoted by Y) and
a series of other changing variables (known as independent variables, usually denoted by X).
- Dataset tips provides a good example, the larger a group size is, the tip will be bigger.
- Two main functions are used to visualize a linear relationship
as determined through regression - regplot() and lmplot().
- Both functions draw a scatterplot of two variables, x and y,
and then fit the regression model y ~ x and
plot the resulting regression line and a 95% confidence interval for that regression.
- Bad data means outliners. They are not included. It is not pure fact.
This is the different from estimations.
- Examining its data scatter plotting, determine to use linear model or non-linear model.
- The following codes are used linear model for both functions.
- lmplot is a figure-level function.
- lmplot() has data as a required parameter
and the x and y variables must be specified as strings.
This data format is called “long-form” or “tidy” data.
- lmplot method is for both linear regression model, and nonlinear regression model.
- regplot is a axes-level function.
- regplot() accepts the x and y variables in a variety of formats
    ---  Using regression linear model 1
    g = sns.lmplot(x="total_bill", y="tip", data=tips)

    ---  Using regression linear model 2
    ax = sns.regplot(x="total_bill", y="tip", data=tips)
13b. non-linear regression model
- After examining the scatter plotting of data, the data fits non-linear.
Then, use non-linear regression model.
- the code sample is as below:
    anscombe = sns.load_dataset("anscombe")
    ...
    sns.lmplot(x="x", y="y", data=anscombe.query("dataset == 'II'"),
           order = 2,           nonlinear
           #order = 1,          linear
           #order = 3,          nonlinear
           #order = 5,          nonlinear
           ci=None)
14a. categorical-data, catplot, scatter
description
- tips dataset
- variable day is a categorical for x-coordinate.
- variable total_bill is a numeric variable.
- relational plotting
- default kind: scatter
- The function returns an object of class seaborn.axisgrid.FacetGrid
- figure-level function, easy to use.
- The dots align vertically.
g = sns.catplot(x="day", y="total_bill", data=tips)
14b. categorical-data, catplot, box
description
- distribution plotting
- kind: box
- The function returns an object of class seaborn.axisgrid.FacetGrid
- figure-level function, easy to use.
g = sns.catplot(x="day", y="total_bill", kind="box", data=tips)
21. sns.FacetGrid and plt.hist
    import matplotlib.pyplot as plt
    import seaborn as sns

    tips = sns.load_dataset('tips')

    sns.set()
    g = sns.FacetGrid(tips, col="time", row="smoker")
    g = g.map(plt.hist, "total_bill")

    plt.show()
data
- The dataset is tips.csv file.
- After being loaded, it is a Pandas DataFrame
- It must take the form of what Hadley Whickam calls “tidy” data
- Each column is a variable
- Each row is an observation
description
- seaborn.FacetGrid creates the 2 * 2 lattice for 4 plots based on the data for column and row.
- matplotlib.pyplot.hist creates each plots for histogram.
- For x-cooridate, the variable is total_bill.
- total_bill is a quantative variable.
- Many are created automatically including the bins, scales...
- To construct a histogram, the first step is to "bin" (or "bucket") the range of values—that is, divide the entire range of values into a series of intervals—and then count how many values fall into each interval for y-coordinate.
- To representation of the distribution of numerical data.
My analysis on method g.map mechanism
- In FacetGrid's constructor, based on the data for column and row, a matrix is created.
- In seaborn.FacetGrid.map method, there are loops for each matrix element.
- Execute the loop
- Prepare the column data and row data for a element.
- The first argument is the plotting method name.
- Pythod has function lanugage feature. The function argument can be a function.
- Call the function with its data.
- build the plotting for that element.
22. sns.FacetGrid and plt.scatter
    ...
    g = sns.FacetGrid(tips, col="time", row="smoker")
    g.map(plt.scatter, "total_bill", "tip")
    ...
Description
- seaborn.FacetGrid creates the 2 * 2 lattice for 4 plots based on the data for column and row.
- matplotlib.pyplot.scatter creates each plots for scatter plotting.
- two variables, total_bill for x, tip for y.
- Relational Plotting
plt.scatter usage differences with and without seaborn.FacetGrid
- ---- using FacetGrid -----------
- seaborn.FacetGrid.map method is needed
to apply a plotting function to each facet’s subset of the data.
- ----- not using FacetGrid ------
- code as below:
plt.scatter(tips['total_bill'], tips['tip'] )
23. sns.FacetGrid and parameter hue
Description
- In method sns.FacetGrid
- Variable time is still used for lattice. Two plots - Lunch, Dinner.
- Variable smoker is not for lattice. Now it is used as hue. Two different colors for the dots.
- Related codes for legend are needed.
    ...
    g = sns.FacetGrid(tips, col="time",  hue="smoker")
    g.map(plt.scatter, "total_bill", "tip")
    g.add_legend()

    plt.legend()
    plt.show()
24. sns.FacetGrid and plotting size
Description
- in sns.FacetGrid, height and aspect are used to define its plotting size.
- Display devices are different, you can find the comfortable setting by trying.
    ...
    g = sns.FacetGrid(tips, col="day", height=4, aspect=.75)
    g.map(plt.hist, "total_bill")

    plt.show()
25. sns.FacetGrid and col_wrap
        ...
        att = sns.load_dataset('attention')
        sns.set()

        g = sns.FacetGrid(att, col="subject", col_wrap=5, height=1.5)
        g = g.map(plt.plot, "solutions", "score", marker=".")
        ...
Description
- Select one variable(subject for this example) as column.
- wrap around the subplots.
- The relational representation between two numeric variables.
- plt.plot method is used. The default kind is line
- solutions for x-coordinate; score for y-coordinate.
- The data is called attention, which is properly sorted.
- Within a subject, solutions is in ascending sort order.
26. sns.PairGrid and plt.scatter
        ...
        iris = sns.load_dataset('iris')
        sns.set()
        g = sns.PairGrid(iris)
        g.map(plt.scatter)
        ...
Description
- Each row in Iris flower dataset contains 4 numeric variables about flower part width or height.
- sns.PairGrid method will create a matrix for the four variables.
The method returns a object of seaborn.axisgrid.PairGrid.
- matplotlib.pyplot.scatter creates each plots for scatter plotting.
- One vs others three and itself in x, y cooridates.
- Relational Plotting
27. sns.JointGrid and sns.regplot, sns.distplot
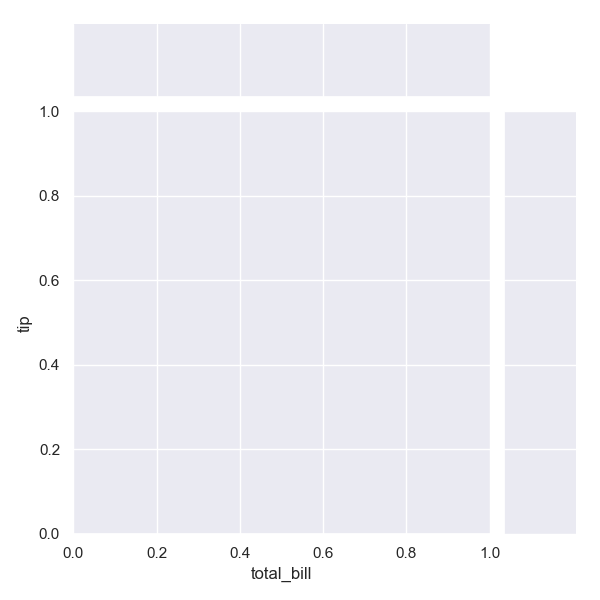
    g = sns.JointGrid(x="total_bill", y="tip", data=tips)
    g.plot(sns.regplot, sns.distplot)
sns.JointGrid
- If you comment out the g.plot method, and run it.
- The plot is shown on the left.
- A class is created as seaborn.axisgrid.JointGrid.
- The g.plot is to prepare a joint plotting.
- The constructor created the lattice for method g.plot.
- There are two parts.
- The main part.
- The second is on the top margin and on the rightmargin.
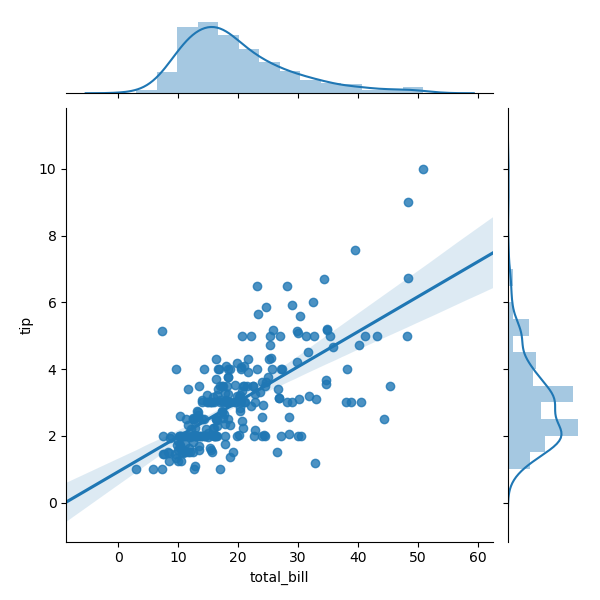
g.plot
- Based on the definition of seaborn.JointGrid.plot
Parameters: joint_func, marginal_func: callables
Both are needed.
Functions to draw the bivariate and univariate plots.
- uncomment go.plot, the right ploting shows
- The joint_func
- sns.regplot for being adaptable
- total_bill in x, tip in y.
- scatter plotting, then reg plotting
- sns.distplot
- sns.distplot for being adaptable
- The one on the top margin is for total_bill.
- The one on the right margin is for tip.
- They are distributin plottings.