01. R Descriptive Statistics
- 4 variables
- Name
- Transmission:factor
- Cylinders:int
- Fuel.Economy:num
- cars <- read.csv("Cars.csv")
- Name and Transmission are factored.
- Create a frequency table
- Transmission is a categorical variable.
- table(cars$Transmission)
- Automatic Manual
19 13
- Fuel.Economy means miles per gallon.
- Fuel.Economy is a numeric variable, it has quantitative value.
- to get the minimum by min(cars$Fuel.Economy)
- Other statistics like max, mean, median, quantile, sd.
- to get all the statistics for all variables, like below:
         summary(cars)


                   Transmission       Fuel.Economy        ....
                 Autumatic:   19       Min.    : 4.000
                 Manual:      13       1st Qu. : 4.000
                                       Median  : 6.000
                                       Mean    : 6.188
                                       3rd Qu. : 8:000
                                       Max.    : 8.000
- Get the correlation coefficient
- The two are both numeric variable.
- The result is -0.852162
- It is pretty correlated. More cylinders cost oil.
- 1 is 100% correlated in a positive way.
- -1 is 100% correlated in a negative way.
- 0 means no correlated at all.
        cor(
                x = cars$Cylinders,
                y = cars$Fuel.Economy)
02. Prediction
PURPOSES
- One purpose of Data Anaylysis is to know the problem domain with data.
- Prediction is another purpose.
code part 1: prepare the data
data(iris)
set.seed(42)
indexes <- sample(
x = 1:150,
size = 100)
indexes
train <- iris[indexes, ]
test <- iris[-indexes, ]
- data(iris) to create an object from iris data set.
- function set.seed(42) to have randonness reproducible for training purpose.
- function sample to generate random number,returning 100 obs. numbers.
- indexes to output the contents to the console.
- The last two is to create subsets, 100 obs and 50 obs respectively.
- train is used for AI to develop the algorithm with the train data with 100 obs.
- test is used for the accuracy of the predictions between the predict values and the real values with 50 obs.
code part 2.1: Train a decision tree model
library(tree)
# Train a decision tree model
model <- tree(
formula = Species ~ .,
data = train)
# Inspect the model
summary(model)
# Visualize the decision tree model
plot(model)
text(model)
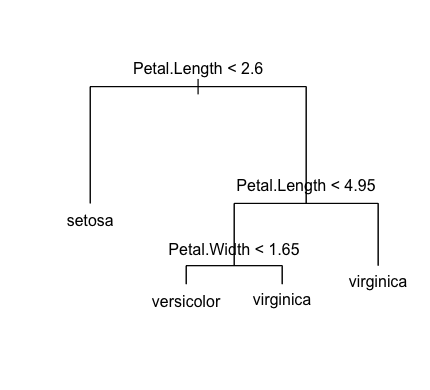
- Function tree analyze the data and develop the algorithm to predict a specy type.
- It is a decision tree model.
- summary(model) to inspect the model.
- Variable Petal.Length and variable Petal.Width are the main factors.
- There are 4 terminal nodes - setosa, versicolor, virginica, virginica
- After plotting it, you can see the picture on the left.
- That is the picture of decision tree model
code part 2.2: Present the train model with a scatter plot
library(RColorBrewer)
palette <- brewer.pal(3, "Set2")
plot(
x = iris$Petal.Length,
y = iris$Petal.Width,
pch = 19,
col = palette[as.numeric(iris$Species)],
main = "Iris Petal Length vs. Width",
xlab = "Petal Length (cm)",
ylab = "Petal Width (cm)")
# Plot the decision boundaries
partition.tree(
tree = model,
label = "Species",
add = TRUE)
#-------------------------------------
# Set working directory
setwd("~/documents/peter_r")
# Save the tree model for others
save(model, file = "Tree.RData")
# Save the training data for others
save(train, file = "Train.RData")
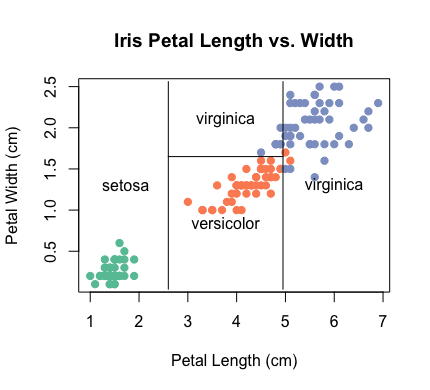
- The scatter plot is on the right hand side.
- Function plot is from the basic.
- Function partition.tree is from package tree.
- The train data are presented in the plot.
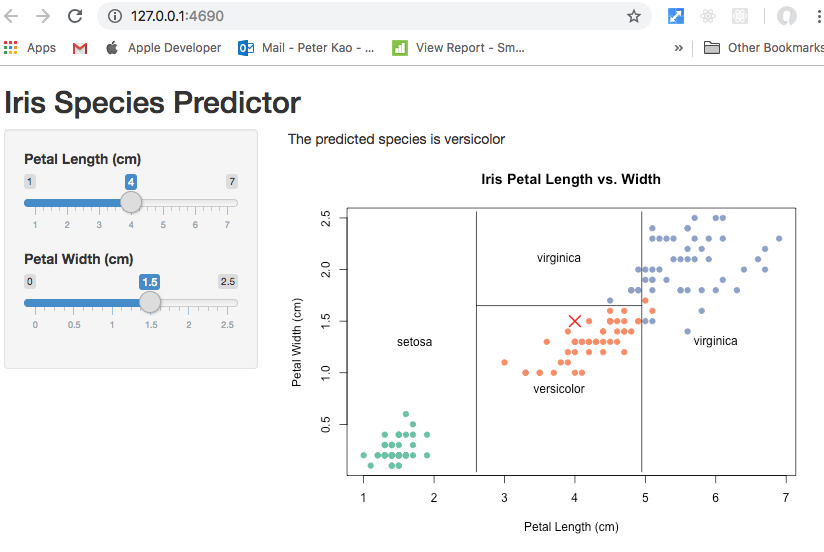
code part 3: Predict
- To use test data - 50 obs with actual Specy type.
- Using their Petal.Length and Petal.Width to predict their species.
- Function confusionMatric from package caret is used to evaluate the prediction results for 50 obs test data.
- The accuracy of the prediction is 0.96. Very Good.
- Tree.RData and Train.RData can be exported to some web app to do this kind predicts.
# Predict with the model
predictions <- predict(
object = model,
newdata = test,
type = "class")
# Load the caret package
library(caret)
# Evaluate the prediction results
confusionMatrix(
data = predictions,
reference = test$Species)