02x. Data in R
| console | result | desc & clean up |
|---|---|---|
| ?diamonds | in help window, provides info. | description, variables info |
| data(package='ggplot2") | in the left-top window, list all the datasets for the package. | data set, diamonds is in the list. After viewing the info, you can close it. |
| head(diamonds) | in the console, you can see the first five rows. | clean the console using the brush |
| x <- diamonds | in the env window under Data x 53940 obs, 10 variables |
|
| y <- c(1, 2, 3) | in the env window under Values y num[1:3] 1 2 3 |
c(1,2,3) is a vector. R vector is 1-based. clean the env window using the brush |
| View(diamonds) | in the left-top windows, you see all the rows like in spread sheet format. click filter icon |
|
| summary(diamonds) | console window, you get the summary report. |
|
| s1 = subset(diamonds, cut %in% 'Fair') | create a subset when cut is 'Fair'. | |
| s2 = subset(diamonds, color %in% 'E' & price > 10000)$price | color in e category, price greate than 10000, 1 variable only. | the subset has 590 obs Using subset function is convenient. It is not as flexible by using package sqldf, the sql knowledge is required. |
03. Import CSV
- CSV is comma separator value data file format.
- R data types
in RStudio, script window, enter the code and run it, see the result as below- typeof("John Doe) ==> character
- typeof("M") ==> character
- typeof(31L) ==> integer
- typeof(150.5) ==> double
- typeof(TRUE) ==> logic
-
in excel, enter 3 rows and 5 columns as below, and save as Peter092118.csv
- John Doe M 31 150.5 TRUE
- Mary Doe F 27 130.5 FALE
- Peter Doe M 38 180.5 TRUE
- copy the file to mac, put it in documents/peter_R folder
- in RStudio, on the right-top window, click import dataset
- select From Text(base)
- select peter092118.csv, click open, pop up the dialog box Import Dataset
- set Heading to yes, clickimport
- in the console, you see the code as below:
peter092118 <- read.csv("~/Documents/peter_R/peter092118.csv")
View(peter092118) - comments
- You can achieve the same result using R function.
- little more lablor, good for automation.
- in the script window, you see the content of the data
- in the env window, under Data
- 3 obs It means 3 rows.
- 5 variables
- changing the headings
colnames() <- c("name", "sex", "age", "weight", "happy")
Now, all the content are correct. - The data structure is data frame
- enter command and execute class(peter092118)
- data.frame
- comments
- peter092118 is an object.
- matrix is a class
- class(...) is a R general function.
- That is why R is object oriented.
- no new(...) is needed. The object is created implicitly.
- A data frame object can have different types, like char, integer...
- Data frame is the main data structure for plotting.
- matrix is another data frame. Its object has one data type.
04. Plot
- Once you have the data prepared, you are ready for plotting.
- data
In the script window, you code as below:
data(iris)
class(iris)
iris
- iris is a data set, available in RStudio.
- line 1 provides general data info.
- line 2 provides more precise data info, 150 obs, 5 variables.
- line 2 also shows the data structure, data frame.
- line 3 presents the data on the console.
- There are 3 species of leaves, and leave's width and length.. info.
- plotting
- clear all, code as below:
-
library(ggplot2)
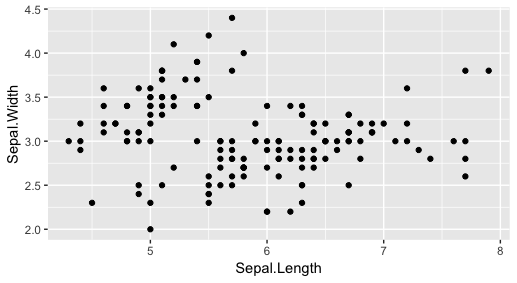
ggplot(iris, aes(x=Sepal.Length, y=Sepal.Width)) + geom_point() - in the plots window, you see the graphics result.
- click export, save it as an image locally.
- ggplot2 is the package name.
- The first line of code is to load the package into the memory.
- ggplot is the function name. The first function argument provides dataset name, The second sets variables for x and y coordinates.
- Based on help("ggplot"),it initialized a ggplot object.
- Based on help("geom_point"), the point geom is used to create scatterplots.
- You can go to the related package ggplot2 documents for more.
- For data visualization, I will try package ggplot2 first.
- In topic 10, more detail about ggplot2 is included.
05. Data from SQLite
- Overview
- The demo is specific for SQLite. For others like mssql, oracle, there must be similar solutions.
- The objective of this topic is to use the data from a sqlite database, then create a data frame for plotting.
- SQLite is file base db. I set a folder to keep the database files.
- Each database has its own file.
- In mac terminal window, create and insert some rows
- In mac RStudio' condole, get the data and create a data frame.
- create a db and insert rows in mac terminal
- In finder window, under mac documents folder, create a new folder, peter_sqlite
- Open the terminal window, go to folder peter_sqlite
- enter command
sqlite3 peter1.sqlite- sqlite installed in my mac
- sqlite3 command can be used any where.
- peter1 is the file name, slqite is the file extension.
- peter1.sqlite is also the database name.
- If it is not there, it will be created.
- The command prompt is changed from $ to slqite>
- The rest is as below:
        sqlite> create table dogs(name string, age int);
        sqlite> insert into dogs(name, age) values("Tairo", 8);
        sqlite> insert into dogs(name, age) values("Emi", 7);
        sqlite> select * from dogs;
            Tairo|8
            Emi|7
        sqlite> .quit
        Ingres:peter_sqlite peterkao$ ls
            peter1.sqlite
- Also, go to finder, to verify it is not an empty file.
- The above are verification steps.
Now, the sqlite database is ready.
- RStudio, console
- getwd()
- setwd("~/documents/peter_sqlite")
- The above is to set the current working folder, containing the database.
- make sure that packages DBI and RSQLite are installed.
- load the packages as below:
library(DBI)
library(RSQLite) - create a connection as below:
mySQLiteDB <- dbConnect(RSQLite::SQLite(), "peter1.sqlite") - get data as below:
doThisSQL <- "select name, age from dogs"
dbGetQuery(mySQLDB, doThisSQL) - further verify the result
result <- dbGetQuery(mySQLDB, doThisSQL)
class(result) #data.frame
result #render the data on the console - Now the data from sql are ready for statistics graphics.
06. Processing data frame with function sqldf
- Package sqldf has a function sqldf. The same name.
- The function does not interface with database.
- But, it uses sql statements to process a data frame.
- This is one way to process data.
        # -----    demo 1  ------------------
        # execute data() to list all the build-in datasets.
        # select one, diamonds in package ggplot2
        # execute diamonds to view the content
        # make sure packages, ggplot2, sqldf are installed and loaded
        # execute the following code to set a subset.

        result <- sqldf("select carat, clarity, price
                         from diamonds
                         where price < 350
                         order by carat")
        result
- notes on demo 1
- sqlfunction does not deal with a database table.
- It deals with a data frame using some sql statments.
- In the console, enter help(diamonds), in the Help window, you can see the data description.
- When you use data() to browse build-in datasets, each one has its own different background. You don't have to know precisely.
- When you deal with plotting, you'll see the same scenarios to choose a sample model.
- Some data frames have different style. For example, mtcars, the row names is not 1,2,3,4,...car type instead like Merc 230....
- You can get the row names with rownames(mtcars).
        # -----    demo 2  -----------------
        #  Package dataset,    dataset  ChickWeight
        #  make sure  ake sure packages, ggplot2, sqldf are installed and loaded
        sqldf("Select Chick, median(weight)
               from ChickWeight
               group by Chick
               order by Chick")
        # execute the code in the control, the sort order is not correct
        # after examine the type of Chick, it is not type int for some reason
        # cast it to int as below, then ok
               order by cast(Chick as int)")
        # The output has aggregate data. You can use the steps in section 7 for distribution..
        # Populate the result to a data frame, and convert it to a csv file.
07. Export CSV
        library(ggplot2)
        my.df <- diamonds
        setwd("~/documents/peter_R")
        write.table(my.df,
                    file = "diamonds.csv,
                    sep = ",",
                    col.names = colnames(diamonds),
                    qmethod = "escape")
- load package ggplot2
- Data frame diamonds is part of the package.
- my.df is data frame name.
- write.table is function name.
- When the above are executed, a csv file is created.
- It is tested in ms excel app with good result.
08. Import a csv file from web
        library(RCurl)
        url <- 'http://www.mj-go-test.com/peter091218.csv?accessType=DOWNLOAD'
        result  <- getURL(url, option=curlOptions(followlocation=TRUE))
        out <- read.csv(textConnection(result))
- desciption
- In ms excel, I created a file and saved into a csv file.
- then, I published the csv file to my web site.
- I installed package RCurl.
- load it.
- define the url
- use getURL function to get data in text format.
- use read.csv function needs an inner function textConnection for text content.
- The final result is in data frame. You can verify by class(out), View(out).
- comment on function language paradigm
- You can see many functions from the previous topics.
- You can create your own function if needed.
- R function is a first class object. The function argument can be executable code.
- CSV is one way to get data from web.
09. Create HTML page from RStudio
- Open RStudio
- In menu, File | New File | R HTML
- in the left-top window, you'll see the code in a sample Rhtml file
- It is a html page.
- Inside the code, there are two tags for R code.
- They are called chunk. They are listed as below:
- click run | click run all
- in console, you see the summary data.
- in Plots window, you see the graphics.
- set work dirctory, save athe Rhtml.
- A image file will be created and save in folder figure.
------------------------------
- The following steps are to create a HTML page from a R html file.
- click Knit button
- save as dist4stop.html in my working directory
- run the html file in a browser. You see the page.
- The summary report is converted into a div tag.
- The graphics is converted into a img tag.
- The html file and the image file can be published into a web site.
10. package ggplot2
10.0 What is ggplot2 and gg
- ggplot2 is de facto standard visualization package in R.
ref: https://www.youtube.com/watch?v=49fADBfcDD4
book: ggplot2 by Hadley Wickman - The solution is in a consistent pattern with grammar.
- It is transparent for learning. It provides rich api(functions) for different graphics. Be progressive.
- gg stands for grammar graphics. It contains 3 parts. Like English grammar, it contains subjects, objects, verbs...
- data
- grammar: mapping from data to visualization. It uses ggplot function.
- layers: rendering. It uses geom series functions. It needs at least one.
10.1 histogram
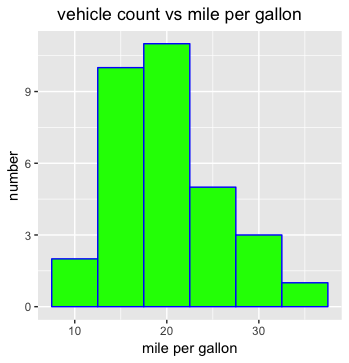
        ggplot(mtcars, aes(mpg))+

        geom_histogram(binwidth=5,color="blue",fill="green")+
        ggtitle("    vehicle count vs mile per gallon")+
        xlab("mile per gallon") + ylab("number")
        data
        - ?mtcars to see the data description.
        - mpg is a variable, miles per gallon.
        - View(mtcars) to view its contents.
        - rowname is car model, like Merc 280c.
        - typeof(mtcars) return double,continuous, not discrete

        ggplot
        - It is a function.
        - aes(mpg) defines the mpg for x-coordinate.
        - one variable only.
        - y-coordinate is the count of the vehicle for each range of mpg

        gemo_histogram, ggtitle, xlab, ylab are all functions.
        - for the 3rd bin as example
        - in x-coordinate, range: 17-22, the difference is 5
        - in y-coordinate, 11 count
        - geom_histogram function presents histogram plot.
        - Other three functions present some descriptive info.
        - The best way to explan when to use histogram is by scenario.
        - For example, in a specific city at specific year, how many women give birth between age 15-16, 17-18,...36-38...

        geom_density function shows a curve instead.

             ggplot(mtcars,aes(mpg))+
             geom_density(color="red",fill="blue")
10.2 Scatter Plot
# note: The above image is for 3 variables.
# scatter plot, x-y correlation
# two variables
ggplot(mtcars,aes(x=wt, y=mpg))+
geom_point(size=3,color="blue")+
ggtitle("correlation for st and mpg")
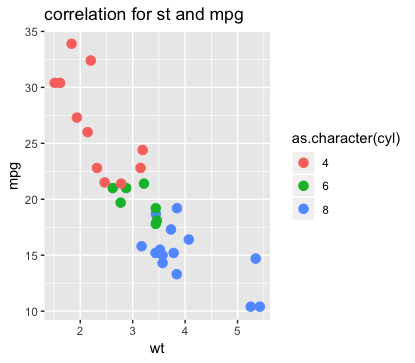
# three variables
ggplot(mtcars,aes(x=wt, y=mpg, color=as.character(cyl)))+
geom_point(size=3)+
ggtitle("correlation for st and mpg")
typeof(mtcars$cyl) #double
#argument color expects a character data type
#The third variable is for group, double type is not for group.
#Cast from double to character is needed for discrete data to group.
# in these cases, you can see they are relatively correlated.
# Lighter cars consume less gas.
10.3 box plot
#box plot
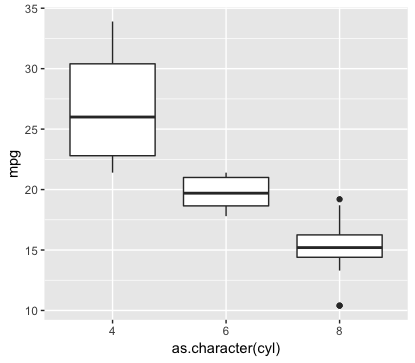
ggplot(mtcars,aes(x=as.character(cyl),y=mpg)) +
geom_boxplot()
#cyl is for group. It is type double, continuous.
# it must be casted into type character, discrete.
#Present with function geom_boxplot.
#in x-coordinate, there are 3 for cyl - 4,6,8
#in y-coordinate, there are statistical data for mpg.
# the dark thick line stands for median, the middle value.
# the upper line is called upper quantile, 25% higher than that.
# the lower line is called lower qunatile, 25% lower than that.
# If you zoom the graphics, you can also see the outliers.
#The purpose is to compare the distribution, like median, not average.
# of variables, like mpg for different groups, like cyl
11. package ggplot2 - case study, Titanic
Study Resource
- My study from datasciencedojo on October 2018
- Topic: Intro to Data Visualization with R and ggplot2
- video: https://www.youtube.com/watch?v=49fADBfcDD4
- download: https://github.com/datasciencedojo/introDataVisualizationWithRAndGgplot2
Overview
- problem domain: Titanic
comment: We must know the background for a data analysis. - data: passengers' information
- analysis: survival study - sex, age, ticket class...
Data and pre-process
- to get data
- make sure package ggplot2 is installed and loaded.
- read the csv file
- execute View(titanic),examine the data in the env window, and the script window.
- to look data
- variable Survived:int, 0,1,1,1,0,0,0. 0 means perished; 1 means survived.
- variable Pclass: int, 3,1,,3,3,4,4,..2.
- variable name: chr,"Braund"...
- variable Sex: chr,"male","female",...
- variable Age: num, 22,38,...
- .....
- to factor
- execute next 3 lines, add factors for 3 variables
- in the env window,
Survived: Factor,1,2,2,1
Pclass:Factor1,2,2,1,...3..
Sex:Factor, 2,1,1
note: R is 1-based
note: You don't deal with Factor values.
Note: When Visualizating, their factor values will be referred. - excute View(titanic) again, there is no change in the data content.
- as.factor is a function name. Not like other language, as is not a language operator.
Analysis 1 - What was the survival rate?
            ggplot(titanic, aes(x = Survived)) +
            geom_bar()
- Because variable Survived is factored, function geom_bar is used.
- Survived is discrete data.
- not geom_histogram
- Between two vertical bar, one for perished, one for survived, there is some small gap.
- x-coordinate: Survived, 0 or 1, one variable
- y-coordinate: passenger count, by default.
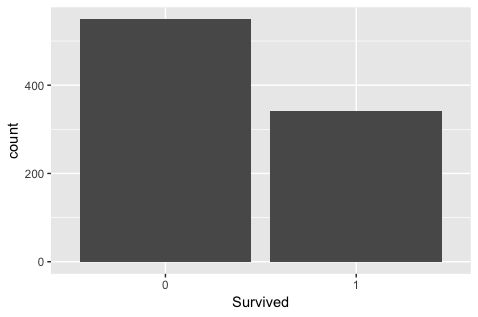
- analysis
- From the graphics, It is apparent that more perish than survival.
- From the scope of this study, we just get the fact.
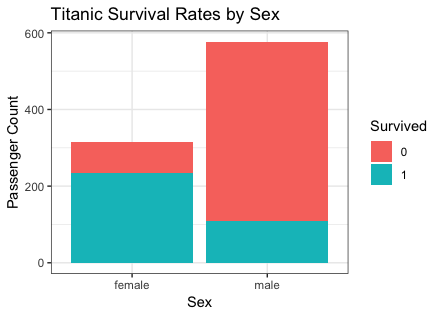
Analysis 2 - What was the survival rate by gender?
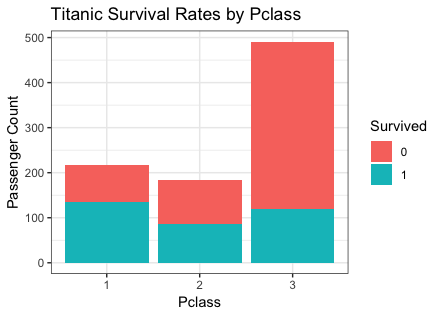
Analysis 3 - What was the survival rate by ticket class?
- They are in the same pattern - two variables.
- Both are discrete.
- fill: One is Survived.
- x-coordinate: The other is either Sex or Pclass.
- y-coordinate: count by default.
- extra argument fill in function aes is needed.
- geom_bar is used, not geom_point for x-y correlation.
                ggplot(titanic, aes(x = Sex, fill = Survived)) +
                theme_bw() +
                geom_bar() +
                labs(y = "Passenger Count",
                       title = "Titanic Survival Rates by Sex")

                ggplot(titanic, aes(x = Pclass, fill = Survived)) +
                theme_bw() +
                geom_bar() +
                labs(y = "Passenger Count",
                       title = "Titanic Survival Rates by Pclass")
 |
 |
- analysis
- From the graphics for Sex, male has lower survived rate than female.
Because women first is the rule. - From the graphics for Pclass, higher the class is, lower the survived is.
Because better class provides better security.
- analysis-2
- Using Sex-Survived graphics as example, the steps are as below:
- Within the bar for female, compute the percentage of survived rate.
- The same for male
- Then, compare those two.
- Without the graphs, you can also use command to compute them.
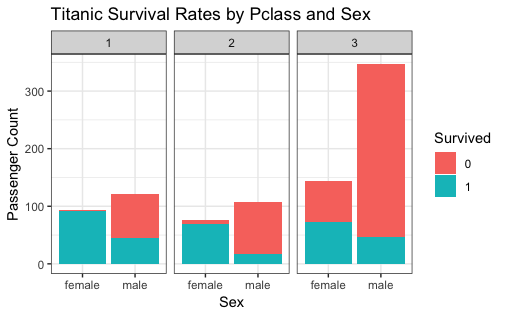
Analysis 4 - What was the survival rate by class of ticket no and gender?
- Here, in addition to Sex, you want add another variable Pclass.
- The solution is to assign a specific panel for each pClass value.
- Use function facet_wrap. Its argument is in R formula. Please see my later topic.
- This is called drill down for focus. Sometimes, it is so requested.
- The code and the graphics are as below.
            ggplot(titanic, aes(x = Sex, fill = Survived)) +
            theme_bw() +
            facet_wrap(~ Pclass) +
            geom_bar() +
            labs(y = "Passenger Count",
                   title = "Titanic Survival Rates by Pclass and Sex")
Analysis 5 - What is the distribution of passenger ages?
- Variable Age is not a factor, continuous, not discrete. Function geom_histogram will be used.
- x-coordinate: Age, its binwidth is defined as 5 here.
- y-coordinate: Passenger count. present together for perished and survived
- The code and graphics are as below.
- For the first bin, the age is between 3-7, count is about 22.
            ggplot(titanic, aes(x = Age)) +
            theme_bw() +
            geom_histogram(binwidth = 5) +
            labs(y = "Passenger Count",
                 x = "Age (binwidth = 5)",
             title = "Titanic Age Distribtion")
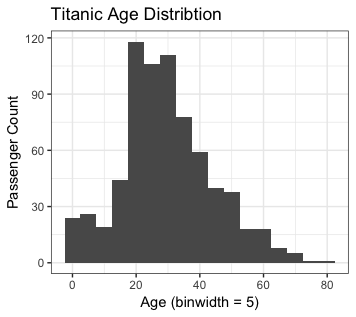
- analysis and one note
- Here, just shows how to create the distribution plotting.
- It does not demonstrate the usages.
- There are some rows without Age info. Those are removed from the process.
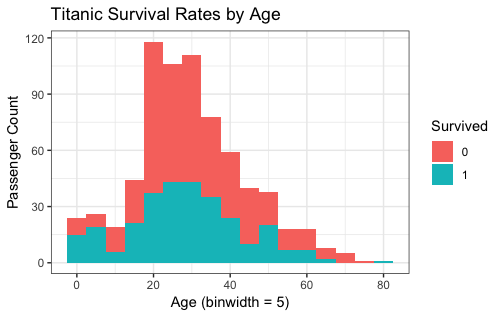
Analysis 6 - What are the survival rates by age?
- Two variables: continuous-Age, discrete-Survived
- There are two plottings for two different views.
- Because Age is not factored, the first plotting is histogram.
- x-coordinate:Age
- y-coordinate:count by default
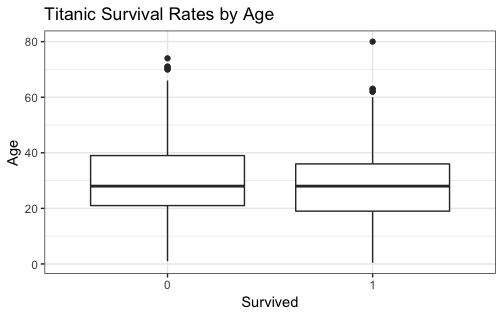
- The second is to use boxplot.
- x:coordinate:Survived
- y:coordinate:Age
- present Age statistical distribution
        ggplot(titanic, aes(x = Age, fill = Survived)) +
        theme_bw() +
        geom_histogram(binwidth = 5) +
        labs(y = "Passenger Count",
             x = "Age (binwidth = 5)",
         title = "Titanic Survival Rates by Age")


        ggplot(titanic, aes(x = Survived, y = Age)) +
        theme_bw() +
        geom_boxplot() +
        labs(y = "Age",
            x = "Survived",
            title = "Titanic Survival Rates by Age")
 |
 |
- analysis and one note
- from the histgram
- Younger the age are, the better are their survived rate.
The reason is that children are first to leave.
- Younger the age are, the better are their survived rate.
- from the boxplot, you can see the Age distribution between perished and survived.
In this case, the two Age distribution are similar. - There are some rows without Age info. Those are removed from the process.
Final
- Analysis 7 is skipped.
- It is a good case study for R visualization. Commented on October 7,2018, Canton MA
12. Pick a Plot Sample and Clone it
- One way to do is to use demo function.
- In the demo, from default package for basic plot.
- in script window, enter demo(graphics)
- in console, keep on hit next to observe the plot window and env window.
- At the end, in plot window, there are many graphics
- Click left or right button, scroll each sample to see their purposes.
- Copy the script for the fist example, Simple Use of Color In a Plot into script window.
- clean up the code, like removing + symbols.
- clean up console.
- Execute one line at a time.
- If you want to apply, then try to understand the details for this specific graphics.
- Some packages have demo function, like lattice, some do not like ggplot2
13. formula
--------------- example from package lattice -------------------------------
- In addition to function in R, R also has formula.
- For most R users, to know how to use formulas is relevant.
- The following is one R code snippet.
        library(lattice)

        #formula  y ~ x
        xyplot(Sepal.Width ~ Sepal.Length, iris)

        #plot multi-variant data
        #display the relationship between variables Y and X separately
        #for every combination of factor A.
        #formula  y ~ x | a
        xyplot(Sepal.Width ~ Sepal.Length | Species, iris)

        # the following three, in console, outputs are all formula.
        class(~ Sepal.Length)
        class(~ Sepal.Length | Species)
        class(Sepal.Width ~ Sepal.Length | Species)
- xyplot is a function in lattice.
- The function first argument is a formula.
- The first formula means the relationship between y and x.
- When the function is executed, R will setup the relations for all at run time.
- Without that, lots of looping, function calls are needed.
- The second argument is the dataset
- -------------------------
- The second formula for plotting multi-variant data
--------------- example from package ggplot2 -------------------------------
- the code and graphics are as below:
        library(ggplot2)

        ggplot(iris, aes(x=Sepal.Length,
            y=Sepal.Width)) + geom_point() + facet_wrap(~Species, nrow = 2)

        class(~Species)    # in console, output is formula
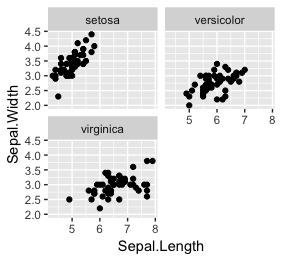
- facet_wrap is a function.
- ~Species is a formula
- In this function, the formula is to use Species for multiple graphics.
14. Base Graphics and Package lattice
                #Base graphics is the default
                # plot(x, y)
                plot(iris$Sepal.Length, iris$Sepal.Width, ces=0.4)

                #package lattice
                # xyplot(y ~ x)        xyplot(y ~ x | a)
                library(lattice)
                xyplot(Sepal.Width ~ Sepal.Length, iris)
                xyplot(Sepal.Width ~ Sepal.Length | Species, iris)
- The second lattice example involved 3 variables, not just x and y.
15. if-then-else, for-loop, apply
- When I tried out R, I usually saw functions are used.
- I rarely saw the code constructs like if-then-else, for-loop.
- Unlike other language like Java, Javascript, Python, C#, R is more statistical analysis oriented.
- Actually, R has these constructs in the following two examples.
- So fare, R is nothing to do with OO. It is an interpret language.
- Function apply is a shortcut for a loop.
- Function apply(WorldPhones, 1, mean)
- loop each year
- for each year, loop each regions, using fucntion mean to compute the mean for each year.
- Function apply(WorldPhones, 2, mean)
- loop each regions
- for each region, loop each year, using fucntion mean to compute the mean for each regions.